Data analytics is a multifaceted discipline that involves the systematic computational analysis of data to uncover patterns, draw conclusions, and support decision-making. At its core, data analytics transforms raw data into meaningful insights, enabling organizations to make informed choices based on empirical evidence rather than intuition alone. The process typically encompasses several stages, including data collection, processing, analysis, and interpretation.
Each of these stages plays a crucial role in ensuring that the final insights are accurate and actionable. The significance of data analytics has surged in recent years, driven by the exponential growth of data generated across various sectors. From healthcare to finance, businesses are increasingly relying on data-driven strategies to enhance operational efficiency and customer satisfaction.
Understanding the fundamentals of data analytics is essential for professionals across all industries, as it equips them with the skills to interpret data effectively and leverage it for strategic advantage. This foundational knowledge encompasses various types of data—structured and unstructured—as well as the methodologies used to analyze them, such as descriptive, diagnostic, predictive, and prescriptive analytics.
Key Takeaways
- Data analytics involves analyzing and interpreting data to make informed business decisions.
- Tools and software like Excel, Python, R, and Tableau are commonly used for data analysis.
- Data collection involves gathering relevant data, while data cleaning ensures the data is accurate and complete.
- Data visualization helps in presenting data in a visual format for easier understanding.
- Statistical analysis helps in making sense of data for non-technical professionals.
Tools and Software for Data Analysis
The landscape of data analytics tools and software is vast and continually evolving, catering to a wide range of analytical needs and user expertise. Popular tools such as Microsoft Excel have long been a staple for basic data manipulation and visualization. Excel’s user-friendly interface allows users to perform calculations, create charts, and analyze datasets without requiring extensive programming knowledge.
However, as data complexity increases, more sophisticated tools have emerged to handle larger datasets and more intricate analyses. Among these advanced tools, programming languages like Python and R have gained prominence due to their flexibility and extensive libraries tailored for data analysis. Python, with libraries such as Pandas for data manipulation and Matplotlib for visualization, offers a robust environment for both beginners and seasoned analysts.
R, on the other hand, is particularly favored in academic circles for its statistical capabilities and rich ecosystem of packages designed for specialized analyses. Additionally, platforms like Tableau and Power BI provide powerful visualization capabilities that allow users to create interactive dashboards and reports, making it easier to communicate insights to stakeholders.
Data Collection and Cleaning

Data collection is a critical first step in the analytics process, as the quality of insights derived from analysis is heavily dependent on the quality of the data collected. Organizations can gather data from various sources, including surveys, transactional databases, social media platforms, and IoT devices. Each source presents unique challenges and opportunities; for instance, while social media can provide real-time insights into consumer sentiment, it may also introduce noise that complicates analysis.
Once data is collected, the next phase—data cleaning—becomes paramount. This process involves identifying and rectifying errors or inconsistencies within the dataset to ensure its accuracy and reliability. Common issues encountered during data cleaning include missing values, duplicate entries, and outliers that can skew results.
Techniques such as imputation can be employed to address missing values, while outlier detection methods help analysts understand whether anomalies should be removed or investigated further. Effective data cleaning not only enhances the integrity of the analysis but also saves time in subsequent stages by preventing misleading conclusions.
Introduction to Data Visualization
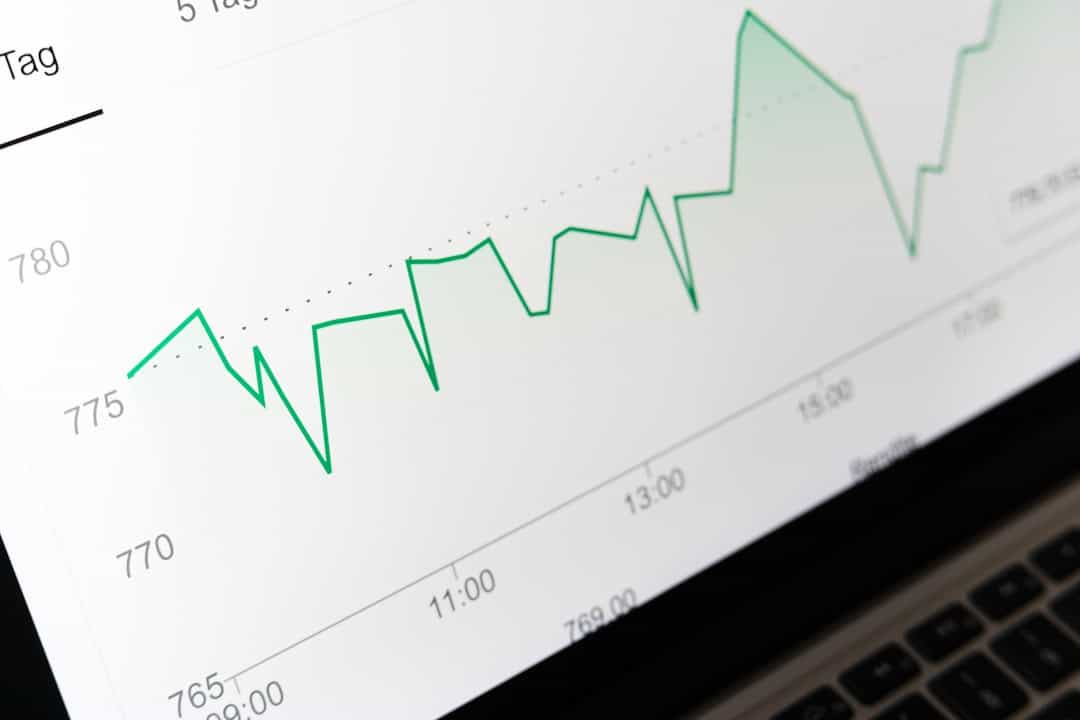
Data visualization is an essential component of data analytics that focuses on representing data graphically to facilitate understanding and interpretation. By transforming complex datasets into visual formats such as charts, graphs, and maps, analysts can convey insights more effectively than through text or numbers alone. The human brain processes visual information significantly faster than textual information; thus, well-designed visualizations can highlight trends, patterns, and correlations that might otherwise go unnoticed.
There are various types of visualizations suited for different types of data and analytical goals. For instance, line graphs are ideal for displaying trends over time, while bar charts are effective for comparing categorical data. Heat maps can illustrate the intensity of data points across geographical regions or within matrices.
Tools like Tableau and Power BI not only allow users to create these visualizations but also enable interactivity, allowing stakeholders to explore the data dynamically. The art of data visualization lies in balancing aesthetics with clarity; a well-crafted visualization should not only be visually appealing but also convey the intended message without ambiguity.
Statistical Analysis for Non-Techies
Statistical analysis serves as the backbone of data analytics, providing the methodologies needed to interpret data meaningfully.
Fundamental concepts such as mean, median, mode, variance, and standard deviation form the foundation of statistical literacy.
These measures help summarize datasets and provide insights into their distribution. Moreover, understanding inferential statistics is crucial for drawing conclusions from sample data about a larger population. Concepts such as hypothesis testing and confidence intervals allow analysts to assess the reliability of their findings.
For instance, a business might conduct a survey with a sample size of 100 customers to infer preferences about a new product line. By applying statistical techniques, they can determine whether their findings are statistically significant or merely due to chance. Resources like online courses or workshops can demystify these concepts for non-technical professionals, enabling them to engage with data analytics more confidently.
Applying Data Analytics in Business

The application of data analytics in business has transformed how organizations operate across various sectors. Companies leverage analytics to optimize marketing strategies by analyzing customer behavior and preferences. For example, e-commerce platforms utilize predictive analytics to recommend products based on past purchases and browsing history, enhancing customer experience while driving sales.
Similarly, businesses can analyze operational data to identify inefficiencies in supply chain management or production processes. In finance, data analytics plays a pivotal role in risk assessment and fraud detection. Financial institutions employ machine learning algorithms to analyze transaction patterns in real-time, flagging suspicious activities that may indicate fraud.
Additionally, predictive models help organizations forecast market trends and make informed investment decisions. The healthcare sector also benefits from analytics by utilizing patient data to improve treatment outcomes and streamline operations. By harnessing the power of data analytics, businesses can not only enhance their decision-making processes but also gain a competitive edge in an increasingly data-driven marketplace.
Ethical Considerations in Data Analytics
As the reliance on data analytics grows, so too do the ethical considerations surrounding its use. Issues such as privacy concerns, data security, and algorithmic bias have come to the forefront of discussions about responsible data practices. Organizations must navigate these challenges carefully to maintain trust with their customers while complying with regulations such as GDPR (General Data Protection Regulation) or CCPA (California Consumer Privacy Act).
These regulations impose strict guidelines on how personal data is collected, stored, and utilized. Moreover, algorithmic bias poses a significant risk in decision-making processes driven by analytics. If historical data reflects societal biases—such as racial or gender discrimination—algorithms trained on this data may perpetuate these biases in their predictions or recommendations.
It is crucial for organizations to implement fairness checks in their analytical models and ensure diverse representation in their datasets. By prioritizing ethical considerations in their analytics practices, businesses can foster a culture of accountability while promoting equitable outcomes for all stakeholders involved.
Resources for Further Learning
For those interested in deepening their understanding of data analytics, numerous resources are available across various formats. Online platforms such as Coursera and edX offer courses from reputable institutions covering topics ranging from basic statistics to advanced machine learning techniques. These courses often include hands-on projects that allow learners to apply their knowledge in practical scenarios.
Books also serve as valuable resources for self-study; titles like “Data Science for Business” by Foster Provost and Tom Fawcett provide insights into how analytical techniques can be applied in real-world business contexts. Additionally, engaging with online communities such as Kaggle or Reddit’s r/datascience can facilitate knowledge sharing among peers while providing access to datasets for practice.
If you’re interested in expanding your understanding of technology beyond data analytics, you might find the article “TheNextWeb Brings Insights to the World of Technology” particularly enlightening. This piece offers a broader perspective on the latest technological trends and insights, making it a great companion read to the “Beginner’s Guide to Data Analytics for Non-Techies.” By exploring both articles, you can gain a well-rounded view of how data analytics fits into the larger tech landscape, enhancing your ability to navigate and understand the digital world.
FAQs
What is data analytics?
Data analytics is the process of examining data sets in order to draw conclusions about the information they contain. It involves the use of various tools and techniques to analyze, interpret, and present data in a meaningful way.
Why is data analytics important for non-techies?
Data analytics is important for non-techies because it allows them to make informed decisions based on data-driven insights. It helps in understanding customer behavior, market trends, and business performance, which can ultimately lead to better decision-making and improved outcomes.
What are the key skills needed for data analytics for non-techies?
Key skills needed for data analytics for non-techies include the ability to interpret and analyze data, critical thinking, problem-solving, and the ability to communicate findings effectively. Familiarity with data visualization tools and basic statistical concepts is also beneficial.
What are some common data analytics tools for non-techies?
Common data analytics tools for non-techies include Microsoft Excel, Google Sheets, Tableau, Power BI, and Google Data Studio. These tools are user-friendly and do not require advanced technical skills to use effectively.
How can non-techies learn data analytics?
Non-techies can learn data analytics through online courses, tutorials, and workshops. There are many resources available that cater to beginners and provide a step-by-step guide to learning data analytics without the need for advanced technical knowledge.